Article
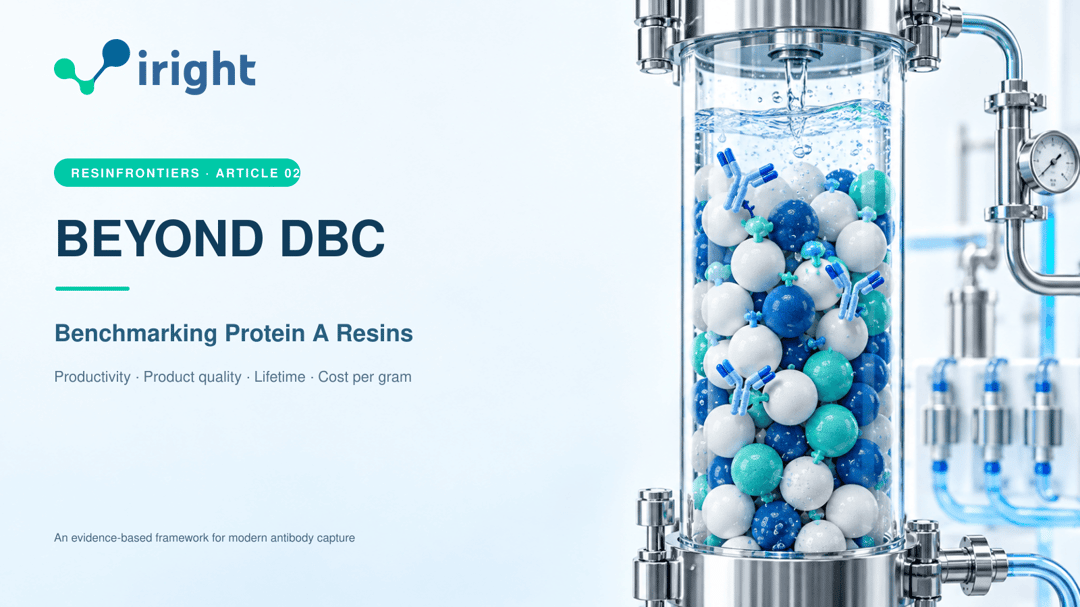
Beyond DBC10%: A Smarter Protein A Resin Benchmark
By Iri · · Updated
Article
By Iri · · Updated
Moving from batch chromatography to periodic counter-current chromatography (PCC) changes the resin-selection question. The best batch resin is not automatically the best continuous resin: the rankin…
Chinese chromatography resins can replace imported products in many development and manufacturing settings, but substitution is not a property printed on a datasheet. It is a conclusion earned at thr…
High-titer fed-batch and perfusion processes are moving the Protein A bottleneck. The question is no longer which resin has the largest number on a data sheet, but which resin delivers the most acceptable antibody per unit time, over the intended number of cycles, at a defensible total cost.
Protein A chromatography remains the default capture operation for most Fc-containing monoclonal antibodies (mAbs). Its selectivity can turn clarified harvest containing thousands of host-cell components into a relatively concentrated antibody pool in one step. That platform familiarity also shortens development: teams know the typical load, wash, low-pH elution and cleaning sequence, and later polishing steps are commonly designed around the Protein A pool.
Yet “high dynamic binding capacity” is often treated as a complete verdict. It is not. Dynamic binding capacity (DBC) changes with residence time, antibody, feed composition, pH, conductivity and the selected breakthrough criterion. A resin can lead at six minutes and lose at two minutes. A small, high-surface-area bead can improve short-residence-time uptake while generating more pressure. A ligand–matrix combination that produces a smaller high-molecular-weight (HMW) fraction can simultaneously co-elute more host-cell protein (HCP), unless the wash is optimized.
This article proposes a practical benchmark for modern antibody manufacturing. It distinguishes peer-reviewed studies, a biopharma-authored industry case study, regulatory guidance and supplier specifications; explains what each source can and cannot establish; and considers where Chinese Protein A resin platforms from Bestchrom, NanoMicro and BioLink fit in a screening strategy.
Protein A binds primarily to the Fc region of many immunoglobulins, enabling high selectivity even when the antibody is only one component of a complex harvested cell-culture fluid (HCCF). Platform use is not just historical inertia. Peer-reviewed reviews from Bolton and Mehta (2016) and Ramos-de-la-Peña and colleagues (2019) describe how ligand engineering, immobilization chemistry, bead rigidity, particle size and pore structure progressively increased capacity, caustic tolerance and productivity. The evidence supports Protein A as the established platform for Fc-containing mAbs; it does not make every Protein A resin equivalent.
That history matters because the value of a capture step is cumulative. It includes:
fast development using established operating windows;
a strong first-step reduction of process-related impurities;
concentration and volume reduction before viral inactivation and polishing;
extensive manufacturing, validation and regulatory experience; and
an ecosystem of resins, prepacked devices, columns, skids and analytical methods.
Protein A is not universal. Fc-free fragments, some antibody formats and molecules with atypical Protein A interactions may require Protein L, another affinity ligand or a non-affinity capture strategy. Even among Fc-containing molecules, variable-region interactions and subclass differences can change binding, wash behavior and elution. “Platform” therefore means a well-supported starting point, not permission to skip molecule-specific development.
This architecture-first view extends the affinity section of iRight’s pillar guide, Chromatography Resin Selection: A Bioprocessing Framework. The pillar article explains how matrix, ligand, particle size and pore structure interact across resin modes; here the same logic is applied specifically to Protein A capture.
A Protein A resin is not simply “Protein A attached to a bead.” Its performance emerges from at least four interconnected design variables.
Ligand sequence and domain design. Recombinant ligands can be engineered for Fc specificity, reduced Fab/VH3 interaction, altered elution behavior and greater resistance to caustic cleaning. Ligand density raises the number of available binding sites, but excessive density can narrow accessible pores and slow diffusion.
Immobilization chemistry. Multipoint or site-directed attachment affects ligand orientation, accessibility and leakage. Two resins using related ligands can therefore behave differently after repeated cleaning.
Pore architecture and particle size. Larger pores can accelerate intraparticle transport but provide less surface area; smaller particles shorten diffusion distances but generally increase pressure drop. The optimal balance changes with residence time and column scale.
Matrix chemistry and rigidity. Highly cross-linked agarose is hydrophilic and has a long process history. Synthetic matrices such as polymethacrylate can offer high rigidity and different pore or surface chemistry. Those differences affect compressibility, pressure–flow behavior, non-specific impurity interactions and sometimes elution pool volume.
Peer-reviewed experimental work illustrates why matrix and ligand must be assessed together. McCaw, Koepf and Conley, working in Process Biochemistry at Biogen Idec, evaluated an alkali-tolerant Protein A ligand on a macroporous polymethacrylate matrix against industry-standard agarose media. Their molecule-dependent results included slightly lower DBC for the tested methacrylate medium, broadly comparable impurity clearance in most cases, little capacity loss after 100 hours in 0.1 M NaOH, and limited compression at typical manufacturing velocities (McCaw et al., 2014, abstract and Figures 1–8). That is not evidence that one matrix class is always superior. It is evidence that architecture creates coupled trade-offs among mass transfer, pressure, impurity interaction and cleaning stability.
For the broader decision sequence—capture, intermediate purification and polishing—see the pillar guide’s purification-stage framework. Protein A belongs in capture, where speed and first-step selectivity matter, but its value must still be measured over the complete cycle.
Static binding capacity (SBC) is an equilibrium measurement. Resin and antibody are incubated long enough for binding to approach equilibrium. SBC is useful for studying ligand utilization and theoretical accessibility, but a 48-hour batch incubation is not a manufacturing cycle.
DBC measures uptake under flow. The most common form, DBC at 10% breakthrough (DBC10%), is the captured mass per packed-resin volume when the column effluent reaches 10% of the feed concentration. It is meaningful only when the antibody, feed, residence time, pH, conductivity, temperature, bed height and calculation method are stated.
Actual productivity goes one step further:
Productivity = recovered acceptable antibody mass ÷ (resin volume × total cycle time)
“Acceptable” is important. Material outside the predefined HCP, residual DNA, HMW, leached Protein A or recovery targets should not be counted as equivalent output. Productivity must also include the entire cycle—equilibration, loading, wash, elution, regeneration, clean-in-place (CIP) and re-equilibration—not only the loading phase.
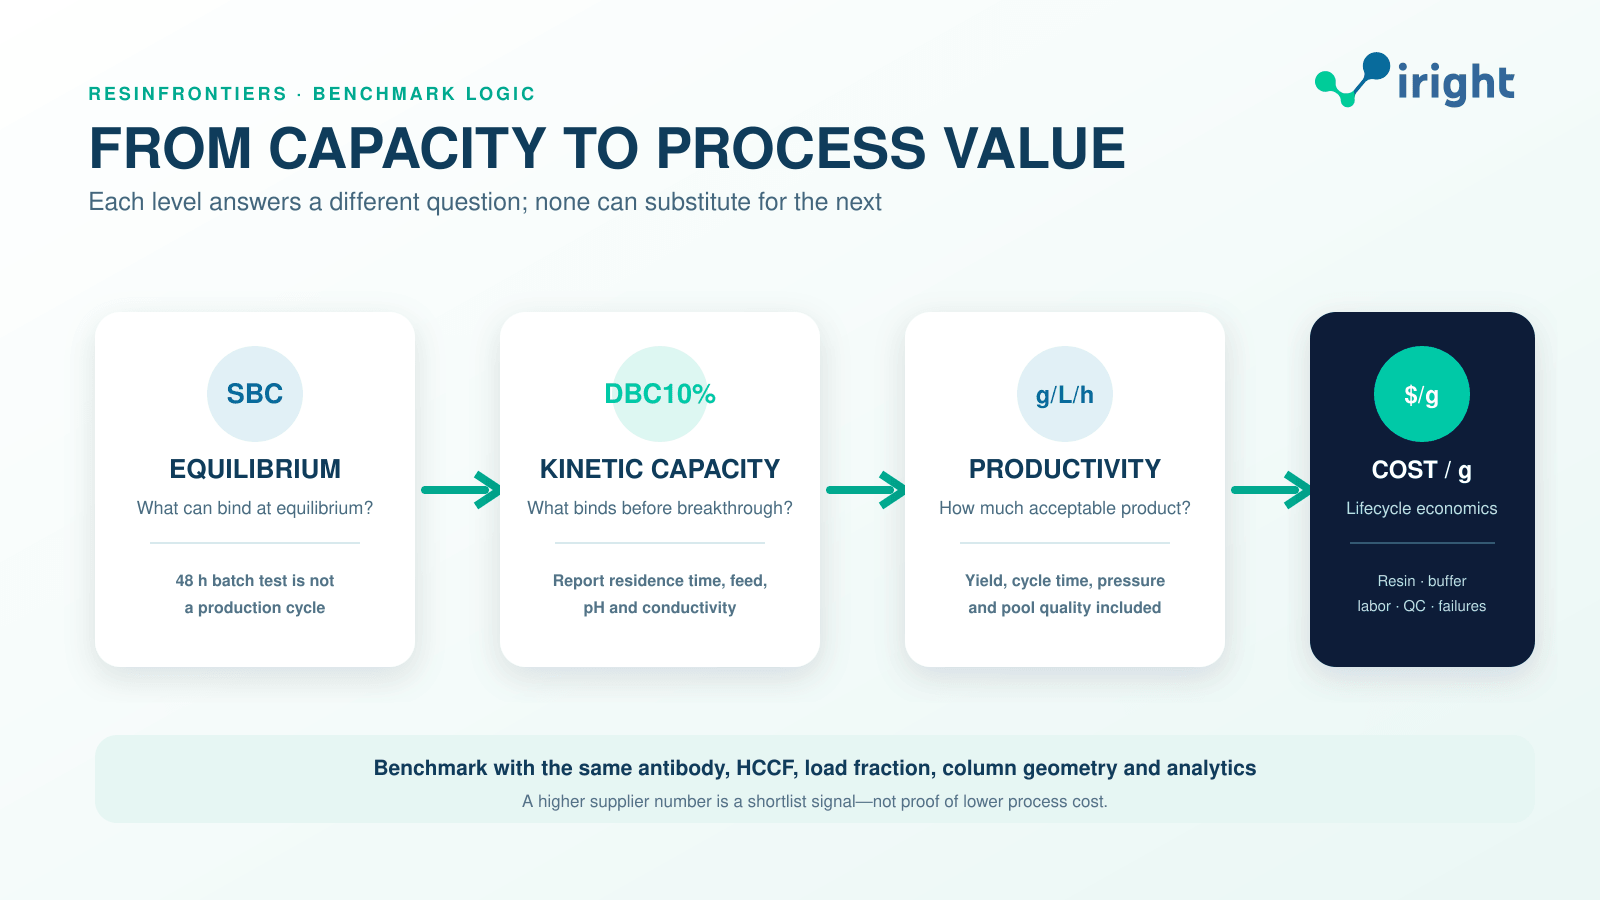
Metric ladder from SBC and residence-time-dependent DBC10% to recovery-adjusted productivity and lifecycle cost
The gap between equilibrium and dynamic performance can be substantial. The paired SBC/DBC experiments in the peer-reviewed methacrylate study show why equilibrium accessibility and flow performance must be reported separately (McCaw et al., 2014, Figures 1–2). The practical lesson is straightforward: SBC can support mechanistic understanding, but it should not size a production column.
The strongest reason not to rank resins by a single DBC value is that mass transfer is time-dependent. For a bed height (H) and linear velocity (u), residence time is approximately (H/u). Shortening residence time increases potential throughput, but gives antibodies less time to diffuse into pores and reach ligands.
The mechanistic foundation comes from peer-reviewed work. Hahn and colleagues fitted film- and pore-diffusion models to three commercial Protein A sorbents and used the parameters to predict packed-bed breakthrough; in that study, DBC became insensitive to residence time only at four minutes or longer (Hahn et al., 2005). The value of the paper is not a current product ranking—the products and manufacturing context have evolved—but the demonstration that pore diffusion and residence time control breakthrough differently across sorbents.
A later five-resin application study in American Pharmaceutical Review tested five CHO-derived antibodies—three IgG2 and two IgG1—over residence times from one to 30 minutes. It was authored by Krunal K. Mehta, Ryan Soderquist, Pranali Shah, Nick Marchand and Glen R. Bolton, who were affiliated with Amgen for the reported work; the acknowledgement also names Amgen contributors. APR is an industry publication, not a peer-reviewed journal. The study is therefore best treated as a transparent, biopharma user-side case study—not as vendor literature and not as peer-reviewed confirmation. Its DBC results are located in § “Dynamic Binding Capacity Studies,” Figure 1, and show no universal ranking (Amgen author team, 2018):
at short residence times, the smaller-particle MabSelect SuRe PCC showed the highest capacity for the molecules tested;
at longer residence times, the higher ligand density of MabSelect SuRe LX produced higher DBC than MabSelect SuRe, whereas their short-time values were more similar because pore diffusion limited access; and
Toyopearl AF-rProtein A HC-650F, SuRe PCC and SuRe LX approached comparable fitted long-time capacities under the study conditions, despite different short-time and hydraulic behavior.
These findings are specific to the tested molecules, feeds and columns; they are not a current market ranking. Their durable conclusion is methodological: measure at the process-relevant residence time and at least one faster condition that probes mass-transfer risk. For a proposed two-minute loading step, a supplier value measured at six minutes is not a prediction—it is a different experiment.
As cell-culture titer rises, the antibody mass arriving at capture increases faster than the harvest volume may change. The process developer can respond by increasing resin volume, loading closer to breakthrough, shortening residence time, adding cycles or using multi-column/continuous capture. Every option moves constraints elsewhere.
A useful first estimate is:
Required resin volume ≈ antibody mass per batch ÷ (validated load per resin volume × planned cycles)
The “validated load” should be below the measured breakthrough capacity and should include a safety margin for lot-to-lot feed variability and resin aging. A higher DBC can reduce column volume, but only if the selected bed can run at the needed flow without exceeding system or column pressure limits. Smaller particles may improve short-time uptake yet raise pressure; a rigid polymer bead may tolerate higher velocity but exhibit different non-specific interactions.
This coupling has been observed in more than one experimental program. McCaw and colleagues found minimal compression for their tested polymethacrylate Protein A resin at typical manufacturing velocities and modelled no scale-up pressure limitation under the stated assumptions (McCaw et al., 2014, Figures 5–7). In the Amgen-authored five-resin case study, the smaller-particle agarose PCC medium generated higher pressure than larger-particle agarose media; the similarly sized methacrylate Toyopearl medium ran at lower pressure under the tested packing conditions, while the silica medium produced the highest pressure (APR study, § “Pressure-Flow Characteristics,” Figure 3). These are condition-specific observations, not a blanket advantage for a matrix class.
Higher loading also does not translate one-for-one into recovered product. In the same Amgen case study, loading high-capacity resins closer to measured DBC improved productivity by roughly 22–27% for one mAb; for another, the increase depended on the resin and ranged from 20% to 60% (APR study, § “Performance at Target Loading,” Figure 4 and Supplementary Figure 1). Those percentages should not be transferred to another process. They demonstrate that productivity is an experimental output, not a synonym for DBC.
Protein A binding is normally disrupted at acidic pH. Low pH is effective, familiar and compatible with a subsequent virus-inactivation hold, but it can stress antibodies. Risk is molecule-specific and depends on the pH trajectory across the elution peak, protein concentration, hold time, temperature, neutralization speed and excipients.
Mazzer and colleagues compared an IgG4 exposed to low pH in solution with the same molecule after Protein A chromatography. Under their experimental conditions, monomer-loss rate constants after chromatography were considerably higher than after low-pH exposure alone (Mazzer et al., 2015). This does not mean every Protein A resin causes aggregation, nor that the lowest elution pH is always unacceptable. It means resin benchmarking should measure HMW species immediately after elution and after the intended low-pH hold—not only final recovery.
A fair elution comparison should therefore determine:
pH at the beginning, apex and tail of the product peak;
pool volume and peak concentration;
monomer and HMW by a qualified SEC method;
recovery before and after neutralization;
the time from first acidic fraction to neutralization; and
product quality after the planned virus-inactivation conditions.
An engineered ligand that allows milder elution may help an acid-sensitive molecule, but that benefit must be demonstrated using the target antibody. Supplier chromatograms obtained with polyclonal human IgG are useful for screening, not proof of aggregate control for a bispecific antibody or Fc fusion.
Capture purity depends on more than affinity for the target. HCP can associate with the antibody, the ligand or the bead surface; DNA and cell-culture components can influence fouling and non-specific binding. Matrix hydrophilicity, pore accessibility, ligand design, feed clarification and wash chemistry all contribute.
The mechanistic evidence for wash optimization is stronger than any single commercial comparison. Shukla and Hinckley found that persistent HCPs were predominantly associated with the product rather than directly with the resin, and showed that washes designed to disrupt product–HCP interactions could improve clearance (Shukla & Hinckley, 2008). This explains why “same wash for every candidate” can be fair as a drop-in test yet unfair as a test of attainable performance.
The Amgen user-side case provides a concrete illustration. Without an intermediate wash, reported eluate HCP was 1,600–2,500 ppm for tested agarose media and 3,500–4,000 ppm for the tested methacrylate medium. With an arginine wash, all fell below 1,000 ppm, while yield declined by 4–8% (APR study, § “Wash studies,” Table 6 and Figures 6–7). The resin did not change; the process did. A benchmark without wash optimization would have measured a starting condition, not each resin’s achievable operating point.
At the same time, lower HMW was observed with the methacrylate resin for the tested mAbs, and one molecule eluted in a larger pool volume. These cross-metric trade-offs are precisely why a single “purity” value is insufficient.
Regulatory guidance does not rank chromatography media. FDA’s implementation of ICH Q6B asks manufacturers to establish and justify specifications for biological products; it is a framework for specifications, not a brand endorsement. In practice, a resin decision should therefore be tied to the downstream control strategy: a modestly higher Protein A-pool HCP may be acceptable if polishing is robust, whereas leached ligand or an HMW increase may be harder to absorb for a particular molecule and process.
CIP has two jobs: remove foulants and control microbial contamination. Sodium hydroxide is widely used because it is effective, economical and familiar, but repeated caustic exposure can damage the ligand or matrix. Modern alkali-tolerant ligands are designed to improve this balance.
Resin lifetime is not “the number of cycles printed in a brochure.” In a peer-reviewed 50-cycle study using monoclonal-antibody cell-culture supernatant, Hahn and colleagues observed no significant loss of purification performance for three tested media, but substantial between-resin differences in leached Protein A and HCP under the study conditions (Hahn et al., 2006). The study is a strong reason to trend multiple failure modes, not a universal 50-cycle guarantee. In a manufacturing program, the relevant endpoint is the first predefined loss of acceptable performance, which may be:
DBC10% below its allowed retention threshold;
declining recovery or broader elution;
increasing HCP, residual DNA, HMW or leached Protein A;
rising pressure or loss of packed-bed integrity;
inadequate removal of carryover; or
failure of the site’s microbial/bioburden control criteria.
A meaningful lifetime study uses real or appropriately representative feed, the intended CIP concentration and contact time, worst-case pauses where justified, and consistent sampling at planned intervals. Fifty to 150 cycles may be an appropriate development range for a reusable resin, but the number should reflect the manufacturing campaign and risk assessment. “150 cycles completed” is not enough; capacity, quality and hydraulic trends across those cycles are the evidence.
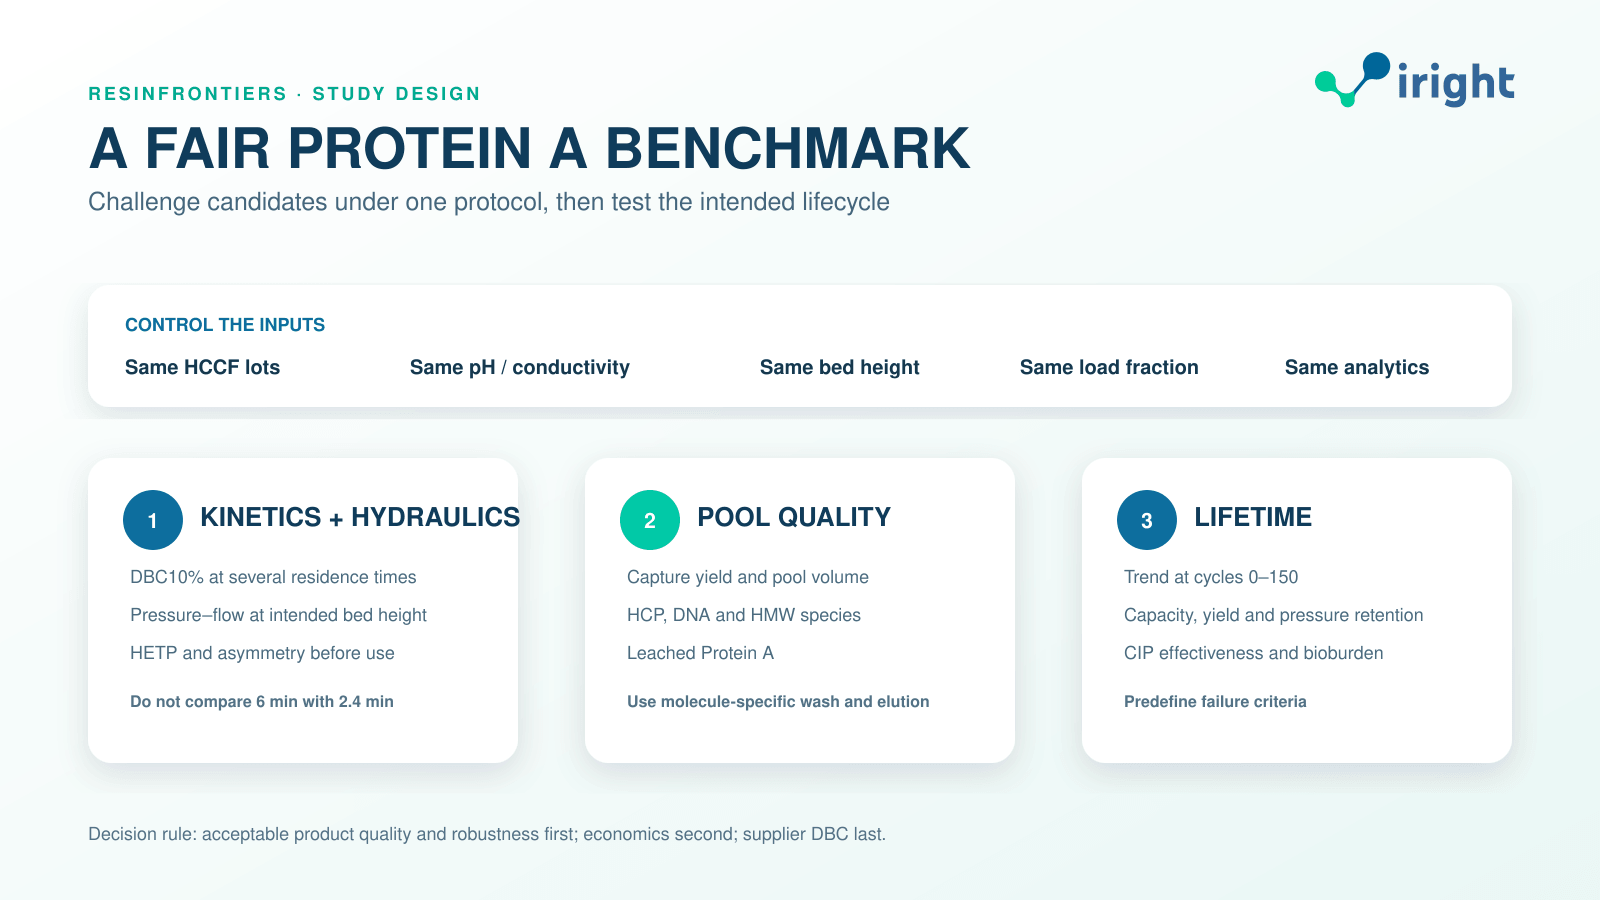
Fair Protein A resin benchmark from packing qualification through DBC10%, hydraulics, product quality and lifetime
The following design makes resin comparisons interpretable and transferable to scale-up.
Study block | Minimum controls | Primary outputs | Common failure |
|---|---|---|---|
Packing and qualification | Same column geometry and target bed height; documented compression; qualified tracer method | HETP, asymmetry, bed integrity | Comparing a well-packed candidate with a poorly packed control |
DBC | Same antibody/feed lot, pH, conductivity, temperature and breakthrough calculation; at least three residence times | DBC10% curve, not one point | Comparing values generated at different residence times |
Pressure–flow | Same bed height, buffer viscosity, temperature and packing state | Pressure drop versus linear velocity | Quoting maximum pressure instead of usable process flow |
Process run | Load each resin at the same fraction of its own measured DBC and use the same collection rule | Yield, pool volume, concentration, cycle time | Loading one resin more conservatively than another |
Pool quality | Same qualified assays and sample handling | HCP, DNA, HMW, leached Protein A | Optimizing the wash for only one candidate |
Lifetime | Intended feed/CIP sequence; predefined checkpoints and failure criteria | Capacity and quality retention, pressure trend, bioburden control | Reporting cycles without performance trends |
Use at least two representative HCCF lots when feed variability is meaningful. Test the intended antibody—not only purified polyclonal IgG—because pI, hydrophobicity, subclass and variable-region interactions can change the result. If the baseline resin already has an optimized wash, allow structured wash optimization for each candidate before the final comparison. Record both the common platform condition and each resin’s optimized condition; the first measures drop-in simplicity, the second measures attainable performance.
The decision rule should be written before results are reviewed. A practical order is: mandatory product-quality and safety criteria; manufacturing fit and robustness; supply and documentation; then lifecycle economics. A weighted score can help, but it should never allow exceptional DBC to compensate mathematically for an unacceptable leached-Protein-A or aggregate result.
Planning a matched Protein A resin screen?Use the iRight Resin Selector to build a three-resin shortlist, then request matched prepacked formats and technical documentation for the same-protocol study. Start a Protein A Resin RFQ
The purchasing price of resin is visible, so it often dominates early discussion. The economically relevant denominator is recovered, specification-compliant antibody:
Cost per gram = annualized resin + buffer + labor + equipment + QC + waste + failure/rework cost ÷ annual grams of acceptable antibody
A high-price resin can be less expensive per gram if it supports a smaller column, fewer cycles, shorter batches, less buffer, longer lifetime or easier polishing. A lower-price resin can win if it provides adequate quality with reliable local supply and avoids schedule risk. Conversely, the theoretical saving from a high DBC disappears if short residence time causes early breakthrough, if extra wash volumes erode productivity, or if higher HCP burden forces an additional polishing step.
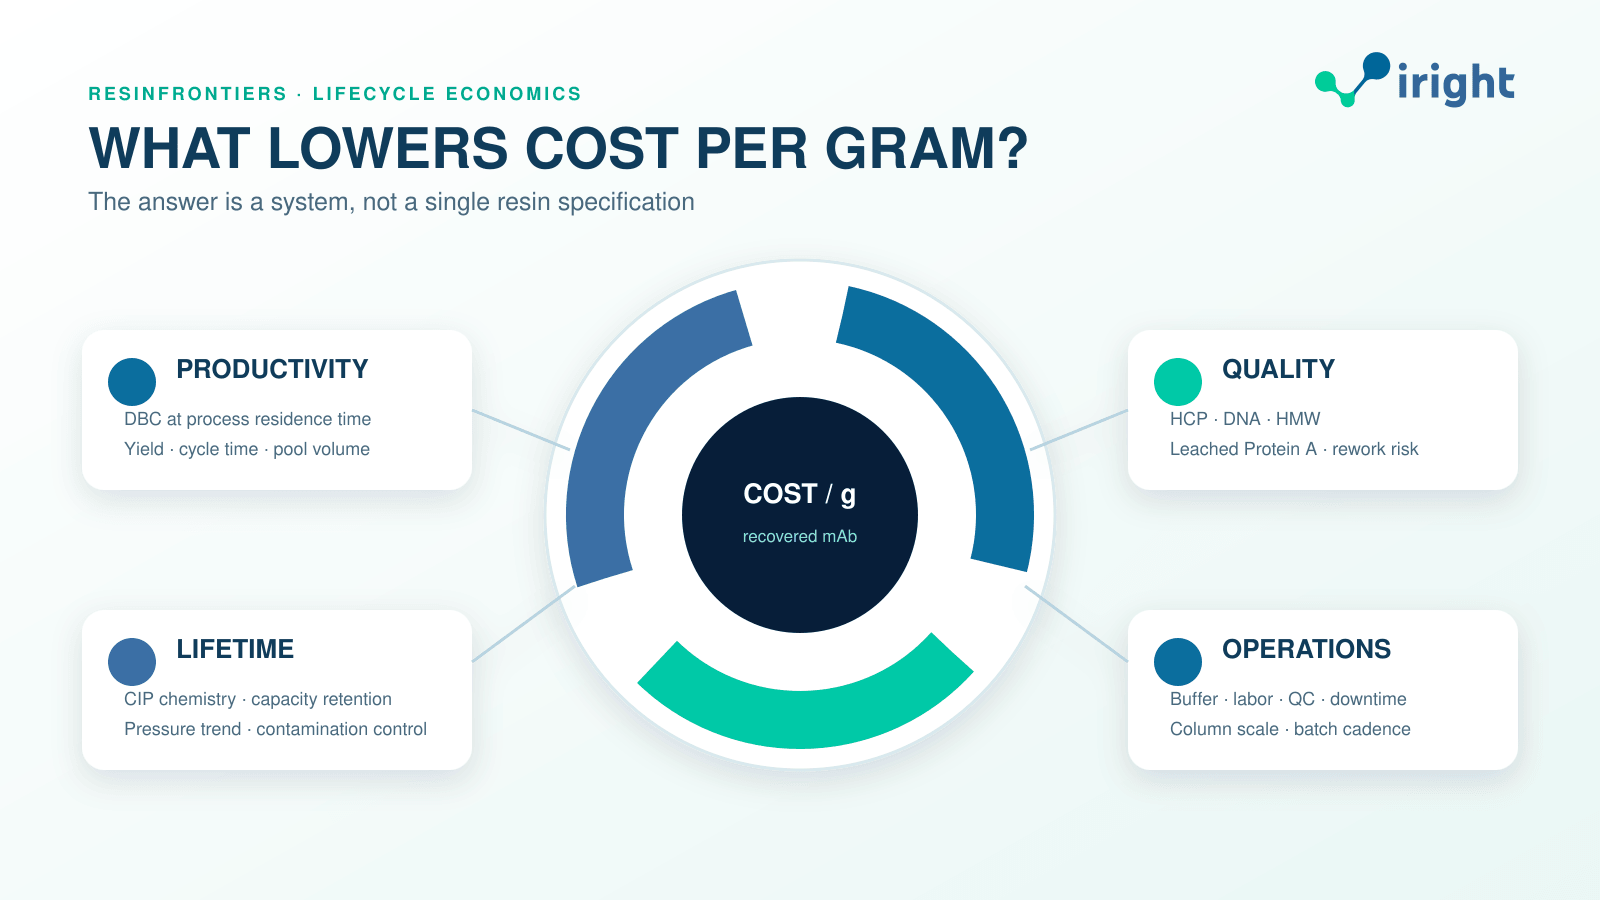
Protein A resin lifecycle scorecard covering throughput, product quality, cleaning stability, supply and cost per recovered gram
Model at least three scenarios: conservative lifetime, expected lifetime and stress-case lifetime. Include resin utilization across the campaign rather than assuming every installed liter reaches the supplier’s maximum cycle claim. Sensitivity analysis usually shows which unknowns deserve more laboratory work—for example, a small uncertainty in resin lifetime may matter more than a 5% difference in initial DBC.
China now has multiple Protein A platforms that merit inclusion in early screening. Public information, however, is uneven and is primarily supplier-generated. The correct conclusion is therefore “candidate for same-protocol evaluation,” not “proven interchangeable.”
Supplier | Publicly described Protein A route | What the public data can support | What still requires direct evidence |
|---|---|---|---|
Bestchrom (博格隆) — iRight shortlist / RFQ · supplier source | High-rigidity agarose with recombinant alkali-tolerant Protein A; Novo-A Diamond and Extrem A Diamond are positioned for high-capacity capture | Supplier reports DBC ≥65 mg human IgG/mL at 6 min for Novo-A Diamond and ≥75 mg/mL at 6 min for Extrem A Diamond, with stated 0.5–1.0 M NaOH CIP compatibility under listed conditions. These are supplier-origin specifications. | DBC at the user’s residence time and HCCF; yield, HCP/DNA/HMW, ligand leakage, pressure at scale and multi-cycle retention |
NanoMicro (纳微科技) — iRight shortlist / RFQ · supplier source | Both agarose Protein A products (NMab family) and rigid polymethacrylate Protein A products (UniMab family) | Supplier’s selector lists NMab Titan HC at ≥80 mg hIgG/mL and 0.5 MPa; it also lists polymethacrylate UniMab 50HC at approximately 50 mg/mL and 0.8 MPa, demonstrating two distinct matrix routes. | The overview does not state one harmonized residence-time method for every listed capacity; direct numerical ranking against other suppliers is therefore invalid without matched protocols |
BioLink (百林科) — iRight shortlist / RFQ · supplier source | Modified-agarose Protein A family, including alkali-tolerant recombinant-ligand products and products positioned for acid-sensitive molecules | BioLink describes MaXtar ARPA as a recombinant Protein A, high-capacity/high-flow, alkali-tolerant agarose medium and reports an FDA Type II DMF filing (No. 037778). | A DMF is a documentation mechanism, not FDA approval or an efficacy/performance endorsement; molecule-specific benchmarking and lifecycle data remain necessary |
These suppliers represent useful but different screening hypotheses. Bestchrom offers a clearly specified high-rigidity agarose route. NanoMicro makes matrix chemistry itself a screening variable by offering agarose and polymethacrylate families. BioLink offers a broad modified-agarose Protein A portfolio and a regulatory-documentation route for one product. None of those public claims replaces a head-to-head study with the intended mAb and process.
For a first screen, select one domestic high-capacity agarose candidate, one domestic alternative-matrix candidate where hydraulic rigidity matters, and the established process control resin. Use prepacked columns where possible, but verify packing equivalence. Advance only candidates that pass product-quality gates at the intended residence time. Then perform a representative multi-cycle study before any claim of substitution or cost saving.
Ready to compare a domestic candidate with your process control?Build the shortlist around one high-capacity agarose route, one alternative-matrix route and one established control, then request the same bed volume and documentation set for all three. Build a Three-Resin Shortlist
The best Protein A resin is the one that repeatedly delivers the required antibody quality at the highest validated process productivity and lowest lifecycle cost within the facility’s hydraulic, cleaning, supply and regulatory constraints.
DBC remains essential for column sizing. It is simply not sufficient for resin selection. A credible benchmark connects residence-time-dependent DBC to recovery, impurity clearance, aggregation risk, pressure–flow behavior, CIP effectiveness, ligand leakage, lifetime and cost per gram. That framework is more demanding than sorting a data sheet, but it is also much closer to the manufacturing decision that ultimately matters.
Use the iRight Resin Selector to narrow the initial candidate set by separation mode, matrix and application. Then apply the same-protocol benchmark described here before scale-up.
Evidence note: Quantitative comparisons in this article are attributed to the cited experimental conditions. Supplier specifications are explicitly labeled and are used only to define candidates for evaluation. No FDA source cited here compares or endorses chromatography resin brands.
ResinFrontiers · iRight Bioprocess Chromatography Intelligence Series
Artificial intelligence can accelerate chromatography resin selection, but it cannot infer a universally “best resin” from catalog specifications. The practical route is a closed evidence loop: gener…