Article
Resin Lifetime: CIP, Reuse and True Cost
By Iri ·
Article
By Iri ·
A conventional IgG platform is a useful starting hypothesis—not a transferable process. Bispecific antibodies, antibody–drug conjugates (ADCs), Fab/scFv fragments and Fc-fusion proteins can differ in…
Chinese chromatography resins can replace imported products in many development and manufacturing settings, but substitution is not a property printed on a datasheet. It is a conclusion earned at thr…
The least expensive chromatography resin is not the resin with the lowest price per liter. It is the resin–process combination that delivers the lowest cost per accepted batch or per gram of released product while remaining inside validated limits for capacity, recovery, impurity clearance, pressure, carryover and microbial control.
That distinction matters more as manufacturers intensify processes, reuse columns more frequently and ask supply chains to reduce both cost and waste. Resin purchase price is visible on a quotation; premature retirement, excessive buffer, additional testing, low recovery and a failed batch are not. A lifecycle program must therefore connect chemistry, feed-dependent fouling, packed-bed mechanics, cleaning efficacy, product quality and economics.
This seventh article in ResinFrontiers · iRight Bioprocess Chromatography Intelligence Series builds on the platform logic in Chromatography Resin Selection: A Bioprocessing Framework, the capture benchmarks in Protein A Resin Comparison: Beyond DBC10%, and the rapid-cycling implications discussed in Continuous Chromatography: Resin Selection for Multicolumn Processing. It focuses on how to establish a defendable useful life—not how to maximize a cycle count at any cost.
A resin is an installed, cleaned, tested and risk-bearing process asset—not simply a volume of beads. The invoice is only one term in the lifecycle equation. A useful project model includes:
packed resin and overpack or yield loss during packing;
column hardware, packing labor and qualification;
equilibration, wash, elution, regeneration, CIP, sanitization and storage buffers;
cycle time, system occupancy and operator time;
routine assays and periodic lifecycle characterization;
waste treatment and disposal;
product loss from incomplete recovery or diversion; and
expected cost of deviations, investigations and premature replacement.
Pollock and colleagues from University College London and industrial collaborators modeled batch, continuous and hybrid antibody manufacturing across the product lifecycle. In their clinical-manufacturing scenarios, product-dedicated Protein A resin could represent about 50% of direct costs because a campaign might end long before the medium reached its potential lifetime; in commercial manufacture, the same contribution was typically about 10% in their model (Pollock et al., 2017). These are scenario results, not universal percentages. They demonstrate why annual demand, campaign length, installed resin volume and realized cycle count must be modeled together.
The core economic denominator should be released or otherwise acceptable product—not loaded mass. A compact metric is:
Resin cost per accepted gram = installed resin cost ÷ cumulative accepted product mass before retirement.
For a complete process metric:
Cost per accepted batch = (amortized resin + buffers + labor + analytics + waste + expected failure loss) ÷ accepted batches.
The expected failure term is important. Extending a column from 80 to 100 cycles saves only twenty cycles of amortized resin; it can be a bad decision if late-life drift increases the probability of a rejected pool, carryover investigation or unscheduled campaign interruption.
Useful life is process-specific. The same catalog product can have different lifetimes with different molecules, harvests, loads, CIP recipes, columns and schedules. Nweke, Rathore and Bracewell’s review from University College London and the Indian Institute of Technology Delhi groups aging into interacting chemical, physical and fouling mechanisms rather than a single loss of capacity (Nweke et al., 2018).
The main drivers are:
Feed burden. HCP, DNA, lipids, particles, aggregates, antifoam and precipitated material can occupy pores, block surfaces or increase pressure.
Target molecule behavior. High hydrophobicity, self-association, low solubility at elution pH and Fc or Fab interactions can change irreversible adsorption and cleaning demand.
Resin chemistry. Ligand sequence, coupling chemistry, base matrix, crosslinking, particle size, pore architecture and ligand density determine chemical and mechanical tolerance.
Operating load. Overloading can raise local concentration, fouling and precipitation; underloading may increase cost without protecting against cleaning damage.
CIP and sanitization. Concentration, pH, additives, contact time, temperature, flow distribution and rinse completeness jointly determine cleaning and damage.
Packed-bed mechanics. Packing quality, compression, flow reversals, pressure excursions, wall effects and repeated depressurization can alter efficiency and flow distribution.
Storage and idle time. Storage solution, temperature, microbial control, evaporation and incomplete equilibration affect the next campaign.
FDA Compliance Program 7346.832M, issued April 14, 2026 and implemented May 14, 2026, is titled Prelicense and Preapproval Inspections of CDER-Regulated Biological Product Manufacturers. It instructs inspection teams to evaluate chromatography-resin lifetimes established and concurrently validated at commercial scale, including periodic review of the qualified state and requalification as needed. Its chromatography section further addresses initial small-scale lifetime models, ongoing commercial-scale validation at approval, scaled verification of cleaning, sanitization and storage, and batch-to-batch trending of chromatography traces, step yields, impurities and other performance measures (FDA Compliance Program 7346.832M, PDF pp. 38 and 52–53). This is not a regulator-specified cycle number; it is an inspection framework for substantiating the process-specific lifetime.
The diagnostic pattern matters because each failure mode needs a different intervention. A falling DBC does not prove ligand hydrolysis; a rising pressure does not prove bead breakage.
Failure mode | Typical cause | Observable pattern | Useful confirmation | Likely response |
|---|---|---|---|---|
Fouling / pore occlusion | HCP, DNA, lipid, aggregate or precipitate accumulation | DBC or mass-transfer loss; sometimes pressure rise and changing elution | Extracted foulant analysis, microscopy or spectroscopic mapping; recovery after stronger cleaning | Improve clarification or wash; screen targeted CIP; reduce load or precipitation |
Ligand degradation or leaching | Repeated alkaline or chemical exposure; proteolysis | Capacity decline, altered selectivity, higher leached ligand | Ligand assay, peptide or MS analysis, comparison with unloaded chemical-aging control | Reduce chemical severity or contact time; use a more stable ligand |
Bead damage / fines | Excess shear, pressure, incompatible chemical exposure | Rising pressure, fines, broader particle distribution and bed instability | Particle imaging, size distribution and pressure–flow testing | Correct packing/operation; lower stress; choose a stronger matrix |
Bed compression or channeling | Packing error, compressible media, flow transients or wall effects | HETP and asymmetry drift, voids, channeling or position-dependent performance | Column test, pressure profile, visual or tomographic inspection | Repack, revise compression factor or flow strategy |
Jiang and colleagues at Bristol-Myers Squibb ran Protein A columns with and without product loading to separate feed fouling from chemical exposure. In the two agarose Protein A media they studied, ligand degradation under mildly alkaline regeneration conditions was the primary cause of capacity decline; lower caustic concentration and stabilizing excipients protected performance (Jiang et al., 2009). Zhang and colleagues at Biogen later studied MabSelect SuRe and MabSelect SuRe LX and showed that cleaning must be strong enough to prevent feed-dependent fouling while avoiding unnecessary ligand damage (Zhang et al., 2017).
The literature does not support one universal culprit. Beattie and collaborators from GSK and Imperial College London used Raman spectroscopy on industrial Protein A media and found evidence consistent with fouling as the principal explanation in their used-resin samples rather than ligand loss alone (Beattie et al., 2022). Feidl and colleagues from ETH Zurich, Bristol Myers Squibb, Politecnico di Milano and DataHow therefore modeled two aging parameters: one for capacity deterioration associated with ligand degradation, leaching or pore occlusion, and another for reduced mass transfer, mainly associated with fouling (Feidl et al., 2020).
Wetterhall and colleagues at Cytiva added molecular-resolution evidence. They compared MabSelect SuRe and MabSelect PrismA after continuous exposure to 0.1–2.0 M NaOH for 1–72 hours, measured remaining IgG binding in high-throughput plates and used high-resolution MS to map ligand modification. Under their conditions, PrismA showed almost no binding-capacity effect after 72 hours in 0.5 M NaOH, with decline first observed after 48 hours in 1.0 M NaOH (Wetterhall et al., 2021). This peer-reviewed but supplier-authored chemical-exposure study clarifies mechanism; it is not a substitute for feed-cycle lifetime data. The practical conclusion is to diagnose, not guess.
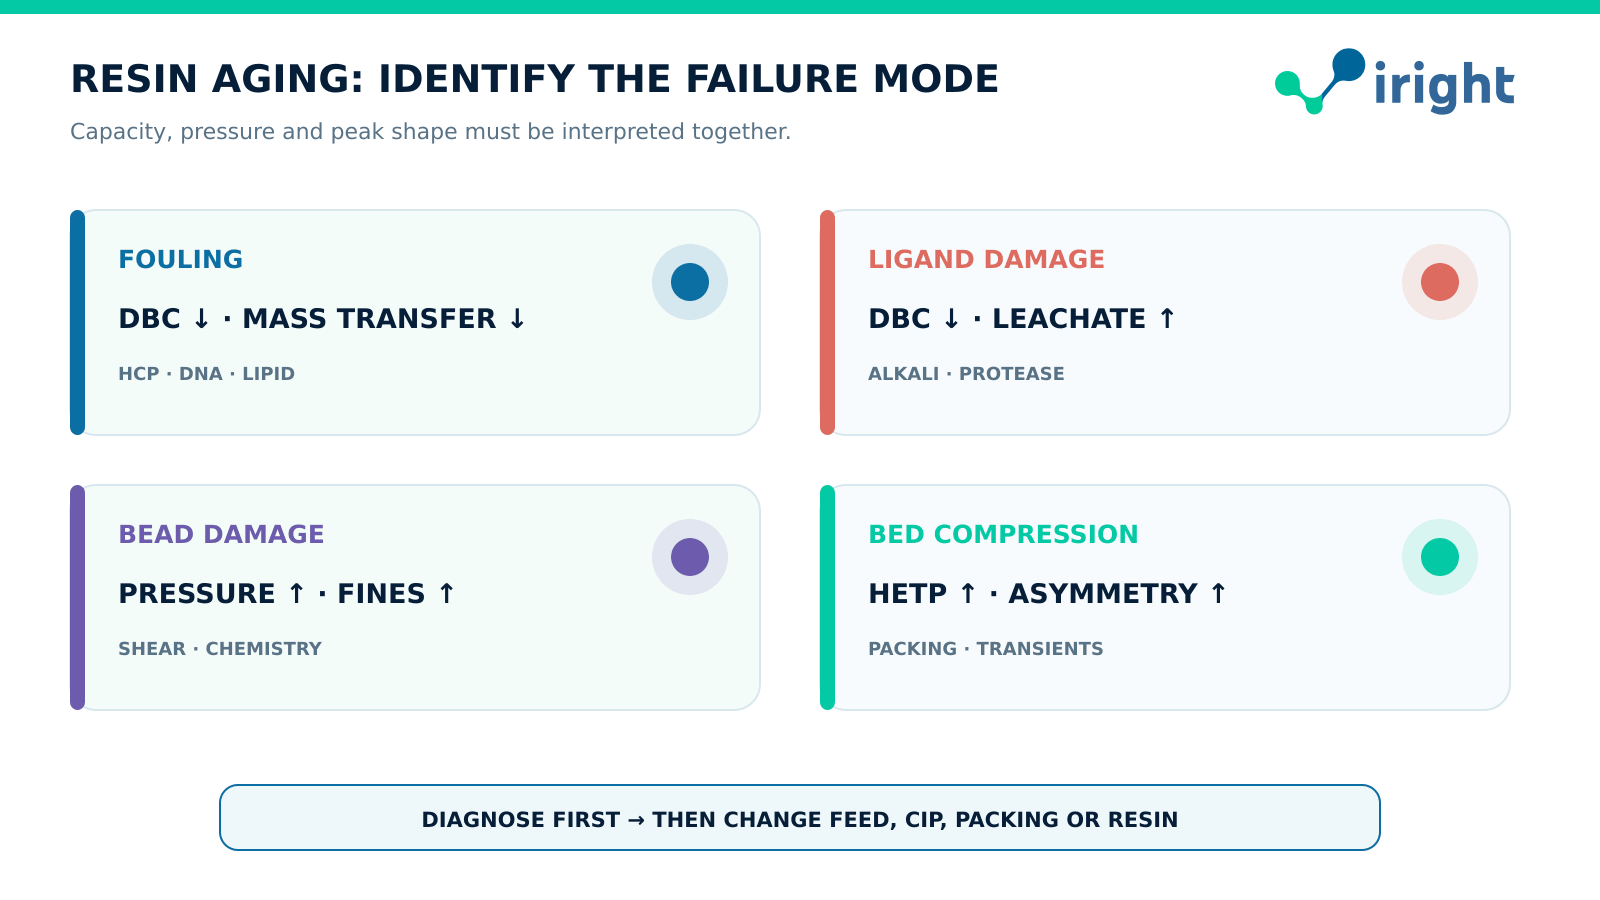
Capacity, pressure and peak shape form a diagnostic pattern: no single metric uniquely identifies the aging mechanism.
CIP is an optimization problem between soil removal and material compatibility. More caustic is not automatically better, and milder is not automatically safer. An underpowered recipe can leave foulants that accumulate over cycles; an unnecessarily harsh recipe can shorten ligand or matrix life.
Three variables must be stated together:
NaOH concentration defines chemical activity, but additives and ionic strength can change cleaning behavior.
Contact time determines cumulative chemical exposure. A 15-minute exposure repeated 200 times equals 50 hours of nominal contact, but continuous soaking is not automatically equivalent to cycled operation.
Temperature affects reaction rate, viscosity, mass transfer and microbial control. Room temperature, cold room and warm process conditions cannot be pooled without justification.
Behere, Cha and Yoon at the University of Massachusetts Lowell modeled two Protein A media exposed to 0.1 N and 0.2 N NaOH and reported retention of up to 96% binding capacity after 240 cycles in their continuous-capture lifetime study (Behere et al., 2018). The result is useful because the concentration and cycle count are explicit; it is not a specification for an unnamed future feed.
Supplier data can define candidates but should be labeled as such. Cytiva reports that a fed lifetime study of MabSelect PrismA used clarified harvest for 150 cycles, while separate buffer-only accelerated studies extended to 300 cycles with 0.5 M NaOH and 150 cycles with 1.0 M NaOH (Cytiva lifetime performance study). The distinction is essential: the 300-cycle claim was an alkaline-stability experiment, not 300 feed purification cycles. For a purchasable comparison, MabSelect PrismA, 1 L (Cytiva 17549803) and MabSelect PrismA X, 1 L (Cytiva 17550103) should be assessed with the same feed and CIP recipe; their catalog descriptions are not a head-to-head lifecycle study.
Wang and colleagues developed a facility-compatible MabSelect cleaning procedure because guanidine-based cleaning created operational and safety disadvantages at scale. Their work illustrates that efficacy, resin compatibility, environmental controls and facility fit must be evaluated together (Wang et al., 2013). Zhou and colleagues at Teva later reported a sequential acetic-acid/benzyl-alcohol and 100 mM NaOH strategy that controlled eight test microorganisms, kept carryover below detection, maintained yield and quality, and showed no carryover through 150 purification cycles in their study (Zhou et al., 2019). That is strong process-specific evidence, not permission to copy the recipe without compatibility and safety studies.
Both are useful, but they answer different questions. A blank or caustic-soak study measures chemical compatibility; a feed cycle measures the combined process.
A defensible program separates at least three arms:
Chemical-aging arm: unused resin receives the intended CIP, sanitization and storage exposure without feed. This estimates ligand and matrix compatibility.
Fouling arm: representative or worst-case feed is processed through the full method. This captures irreversible adsorption, precipitation and impurity burden.
Cleaning challenge arm: intentionally fouled material is exposed to alternative recipes to compare soil removal, microbial control and material damage.
Grönberg and colleagues at GE Healthcare and industrial partners developed a high-throughput approach to screen fouling and regeneration conditions with MabSelect SuRe before confirming selected recipes in columns (Grönberg et al., 2011). This is a good division of labor: plates or miniature columns rapidly rank conditions; a geometrically and hydrodynamically relevant column confirms the process.
Accelerated studies require guardrails. Increasing NaOH concentration, temperature or exposure time can compress the schedule, but acceleration may change the dominant degradation pathway. Likewise, one high-load feed cycle is not necessarily equivalent to several normal cycles because pore saturation, precipitation and wash efficiency may be nonlinear. Bridge accelerated and real-time studies at shared time points, and define what the acceleration factor represents.
At minimum, sample new, early, middle and end-of-life resin. A 100-cycle study might analyze cycles 1, 10, 25, 50, 75 and 100, with more frequent testing when a trend accelerates. Use the same reference sample, analytical method and breakthrough definition across the study. Record actual NaOH concentration, temperature and contact time—not only programmed values.
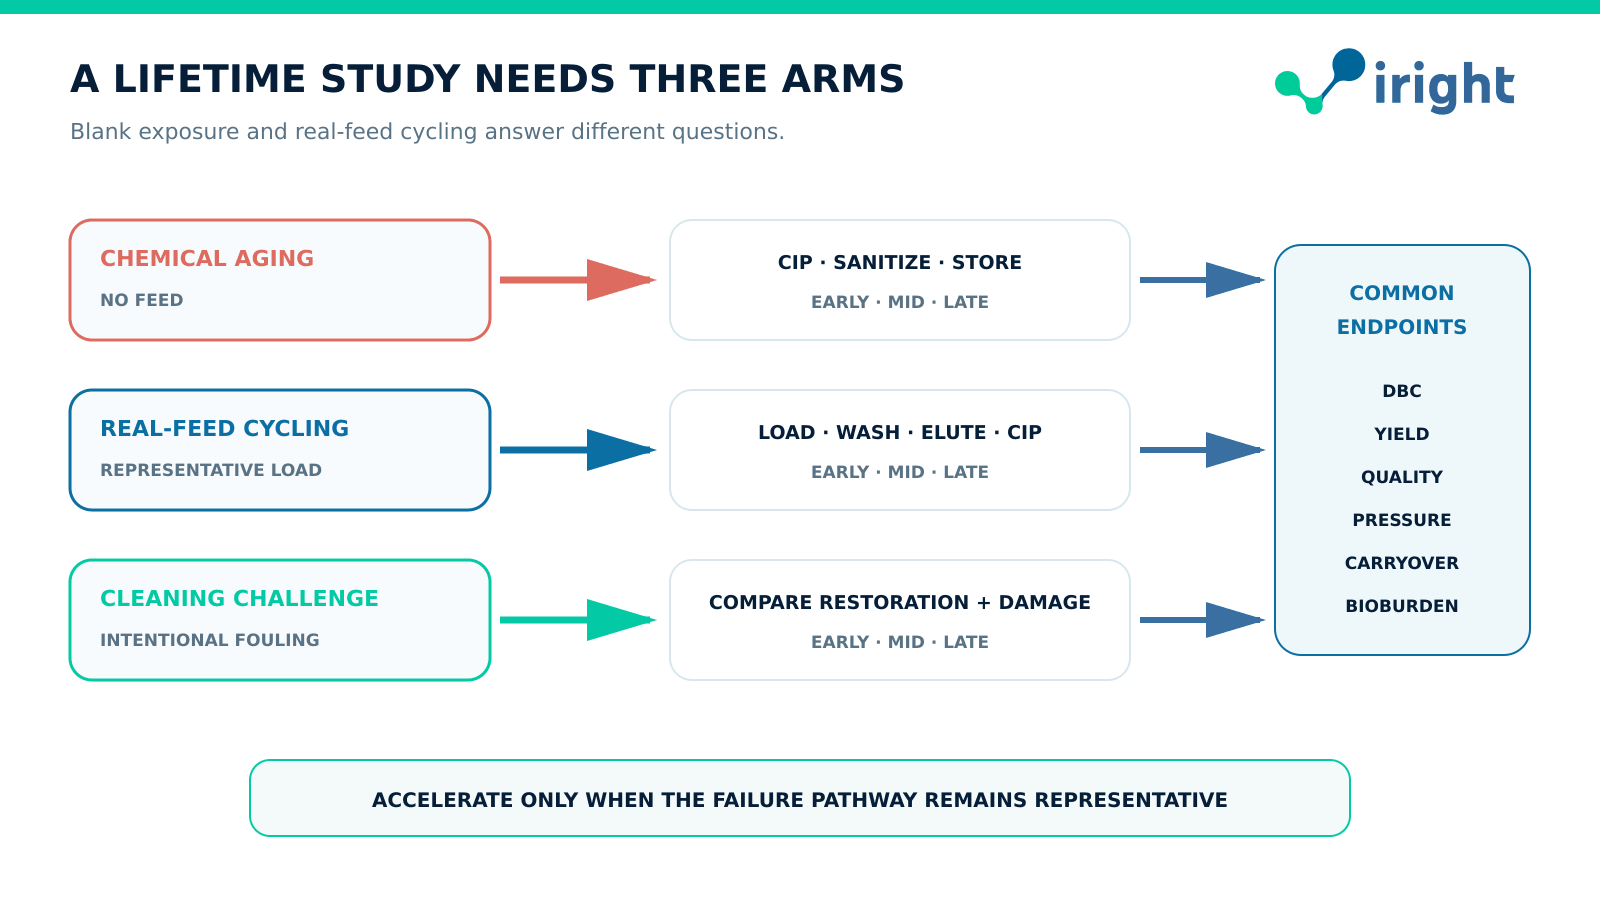
Blank exposure isolates chemical compatibility; real-feed cycling captures fouling and product effects; a cleaning challenge tests whether a stronger recipe restores performance without creating new damage.
DBC alone is necessary but insufficient. Retirement can be driven by a quality, hydraulic, cleaning or microbiological attribute before capacity fails. The lifecycle panel should match the resin’s role.
Attribute | What to report | Why it matters |
|---|---|---|
Capacity | DBC1%, DBC5% and DBC10% at stated residence time, feed concentration and breakthrough method | Detects loss of usable capacity and changes in mass transfer |
Recovery and pool volume | Step yield, concentration, elution volume and mass balance | Reveals irreversible binding, incomplete elution and dilution |
Product quality | Monomer, HMW/LMW, charge profile and potency where relevant | Detects selectivity drift or product damage |
Process impurities | HCP, DNA, endotoxin and residual Protein A or other ligand | Confirms impurity clearance remains inside the process control strategy |
Column efficiency | HETP, asymmetry and peak width using a defined test | Detects packing, channeling and dispersion changes |
Hydraulics | Pressure–flow curve in buffer and representative feed | Detects compaction, fines, blockage or system drift |
Cleaning | TOC/protein in blank eluate, carryover-specific assay and rinse endpoint | Demonstrates residue removal rather than assuming it |
Microbiology | Bioburden, endotoxin and storage-hold verification | Supports sanitization and between-campaign control |
Do not convert supplier examples into generic limits. A rule such as “retire at 80% of initial DBC” is only acceptable if the process at 80% still meets load, yield, quality and scheduling requirements. Another process may require 90%; a lightly loaded polishing column may be retired for pressure or viral-clearance reasons while DBC remains high.
Trend raw values and normalized values. Normalization makes different columns comparable, while raw values preserve operational meaning. Fit a trend only when the model is appropriate; a late-life step change after a pressure excursion should not be hidden by a straight regression line.
Modern PAT can make trend detection earlier. Ramakrishna and Rathore from Biocon Biologics and the Indian Institute of Technology studied chromatographic transition signals for online detection and control of Protein A aging (Ramakrishna and Rathore, 2024). The authoritative record is Journal of Chromatography B 1234:124010. Such tools can forecast drift, but the release and retirement decision still needs qualified measurements and predefined action limits.
A column can retain capacity and still be unsuitable for further use. Three risks deserve independent acceptance criteria.
Leached ligand is both a process impurity and a diagnostic signal. Measure it in product pools with a method suitable for the resin ligand and matrix. The concentration can depend on load, wash, elution pH and assay recovery; compare mass per cycle as well as concentration when pool volume changes. An apparent stable value may mask increasing total mass if elution volume expands.
Carryover is product- and sequence-specific. A blank run after cleaning is more informative than TOC alone when the preceding molecule can be detected by a specific immunoassay, LC–MS method or activity assay. The FDA’s cleaning-validation guidance expects scientifically justified residue limits, validated sampling and analytical methods, and attention to cleaning between campaigns (FDA Cleaning Validation Guide, 1993).
Microbial control includes routine bioburden, sanitization efficacy, storage-solution effectiveness, maximum dirty and clean holds, and recovery after extended storage. A strong alkaline recipe may inactivate organisms but damage an affinity ligand; a mild recipe may preserve capacity but fail the sanitization objective. Zhou’s 150-cycle study is valuable because microbial challenge, carryover, product quality and viral-clearance comparability were assessed together, not because 150 is a universal target.
For candidate screening, MabSelect SuRe LX, 1 L (Cytiva 17547403) and MabSelect SuRe 70 (Cytiva 17542411) provide useful differences in capacity and vendor-stated alkaline tolerance. The decision should be based on cumulative accepted mass, impurity clearance, leached ligand and CIP performance in the intended process—not product-family hierarchy.
Technically, multiproduct resin reuse can be demonstrated; regulatorily, it is not the default assumption. The risk case must cover product carryover, cleaning effectiveness, sequence, viral and microbial control, traceability, column performance and the impact on every subsequent product.
Franklin and colleagues from Amgen described a methodology that continuously monitors resin and column performance, cleaning and product carryover; a blank elution after inter-campaign cleaning is used before changeover, with acceptance limits derived from first principles (Franklin et al., 2018). Ravi and colleagues at AstraZeneca used MabSelect PrismA for three antibodies and reported negligible protein carryover and no material process-performance impact through 90 total cycles—30 per antibody—in their study (Ravi et al., 2023). Merck researchers described a GMP clinical implementation for shared AEX and CEX media using risk assessment, NaOH cleaning and tested blank elution, which they reported to health authorities (Senczuk et al., 2024).
The FDA program does make a direct distinction in its chromatography section: resins or adsorbers can be reused but should be product-dedicated, whereas column housings need not be product-dedicated when adequate cleaning validation and changeover procedures are in place (FDA Compliance Program 7346.832M, PDF p. 52). It also instructs inspectors to confirm resin dedication and application consistency. Regulatory inference: the Amgen, AstraZeneca and Merck studies demonstrate technical feasibility under defined programs, but they do not by themselves authorize a shared-resin strategy for another product, site or filing. A U.S. sponsor considering multiproduct resin reuse should build a product- and site-specific justification and determine the appropriate FDA engagement for its submission strategy. Dedicated reuse within one product remains the lower-complexity baseline.
Retirement should be triggered by the first breached critical limit, not by a supplier’s maximum cycle claim. The protocol should predefine hard limits, alert limits and investigation rules before cycling begins.
Hard retirement criteria commonly include:
insufficient DBC at the validated residence time to process the planned load;
recovery or product quality outside the accepted trend or specification;
HCP, DNA, aggregate, endotoxin, ligand or viral-clearance performance outside the control strategy;
pressure, HETP or asymmetry outside the qualified packed-bed range;
carryover or blank-run residue above the justified limit;
failed sanitization, storage or microbiological acceptance; or
physical damage, channeling, leakage or an unrecoverable pressure excursion.
Alert limits should lead the hard limit. A forecast that a column will cross the limit during the next batch may justify planned retirement even if the current cycle passed. Include a rule for exceptional events: a single severe pressure spike, incorrect CIP concentration, extended dirty hold or microbial excursion can invalidate the remaining-life forecast.
Do not use only relative change. “20% capacity loss” has different consequences when initial DBC is 80 g/L versus 45 g/L and when the process loads at 30 versus 40 g/L. Convert the late-life measurement into operational margin: maximum permissible load, breakthrough risk, number of cycles, processing time and pool quality.
For IEX or mixed-mode polishing, the decisive endpoint may be selectivity or viral clearance rather than target DBC. A product such as Capto S ImpAct, 1 L (Cytiva 17371703) should therefore be aged with representative feed and evaluated for aggregate or charge-variant resolution, HCP clearance and pressure—not judged by chemical soak alone.
The economic model should use validated usable cycles and cumulative accepted output, then test uncertainty. Start with four blocks.
Include quoted resin price, pack loss, extra volume, packing labor, column test, storage and disposal. Amortize over the lower of validated cycles, campaign demand or time-limited storage life.
Include all buffers, water, CIP chemicals, filters, sensors, labor, system occupancy, energy and waste. Stronger CIP may reduce fouling but increase chemical, rinse and waste costs.
Include lifecycle samples, ligand assay, HCP/DNA, TOC, bioburden, endotoxin and investigations. Apply an expected cost to failure scenarios rather than pretending they are free.
Use accepted mass after recovery and quality gates. If resin A yields 1% more product than resin B, that difference can outweigh a purchase-price premium at commercial scale.
Run sensitivity analyses for realized cycles, DBC, feed titer, recovery, buffer volume, cycle time and failure probability. A tornado chart often shows that realized cycles and recovery dominate resin list price. Compare at three horizons: a short clinical campaign, a base commercial campaign and a high-demand case.
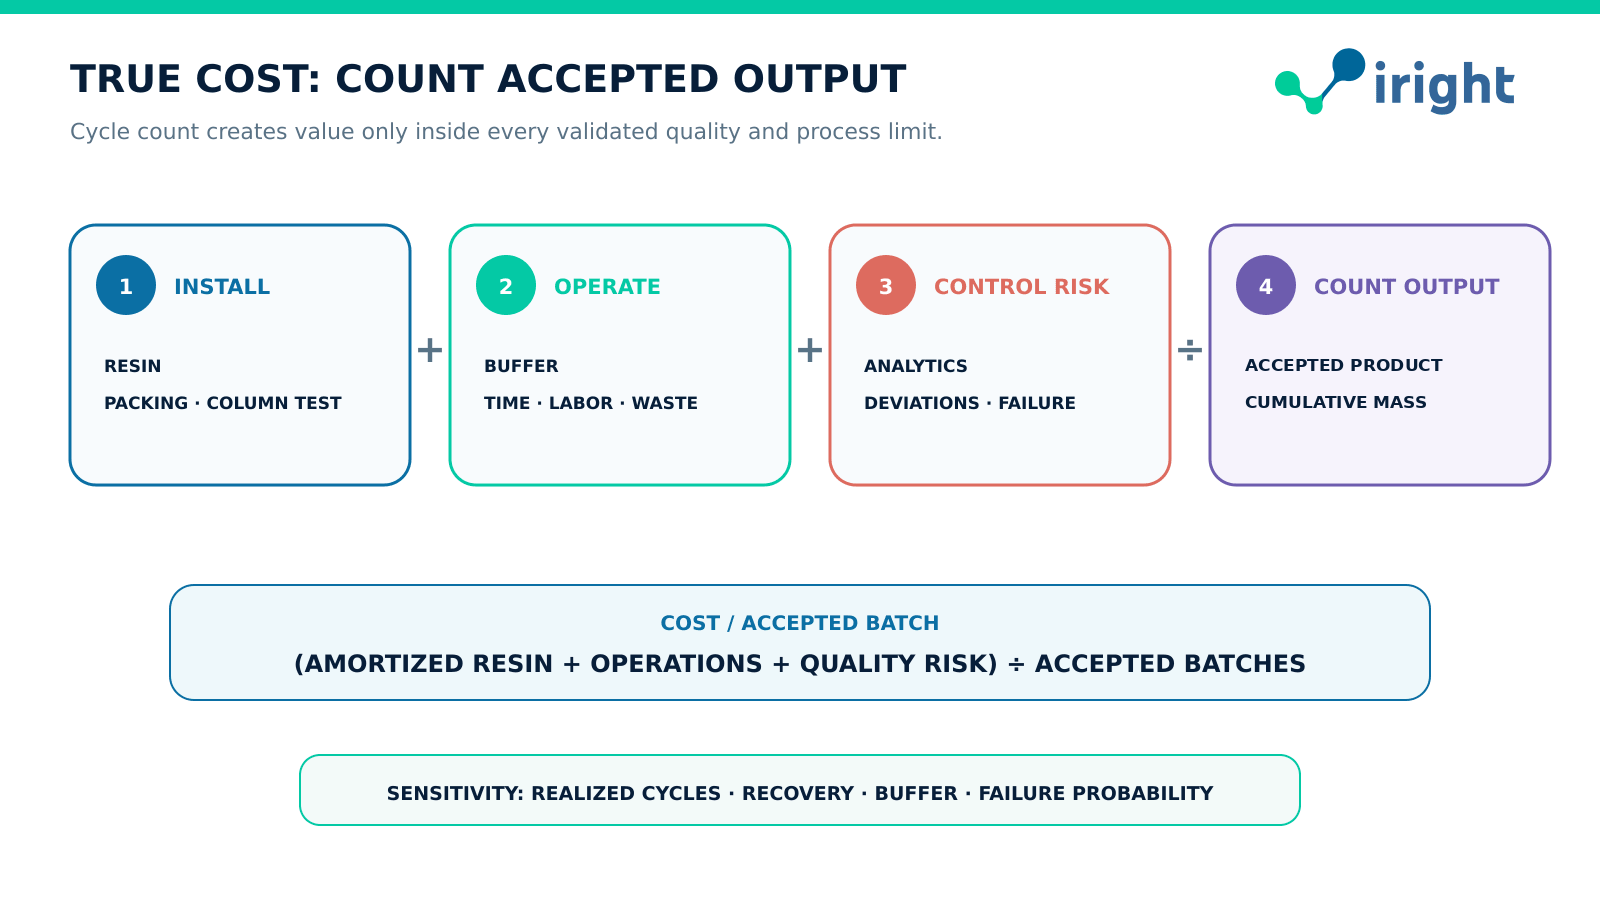
The denominator is cumulative accepted output. Extending cycle count creates value only while recovery, quality, hydraulics and contamination control remain within limits.
Chinese resins can be credible lifecycle candidates, but a domestic-substitution claim requires matched experiments and lot-to-lot evidence. Bio-Link is a logical primary Chinese candidate because its public material covers Protein A lifetime studies, IEX viral-clearance aging and application-center support; NanoMicro and Bestchrom remain useful broader-portfolio comparators. Supplier-generated evidence must not be presented as independent confirmation.
Candidate | Public lifecycle evidence | What it supports | What remains to be demonstrated |
|---|---|---|---|
Cytiva MabSelect PrismA / PrismA X | The cited PrismA supplier study reports 150 feed cycles; separate buffer-only accelerated studies report 300 cycles at 0.5 M NaOH and 150 cycles at 1.0 M NaOH | Strong candidate definition for high-alkaline-stability Protein A capture; no cycle result is transferred automatically from PrismA to PrismA X | Same-feed comparison, process-specific cleaning, leached ligand, pressure and cumulative accepted mass |
Bio-Link MaXtar ARPA | Bio-Link reports >90% initial DBC after 200 cycles of 0.5 M NaOH for 15 min; a separate supplier case study reports 200 feed cycles, >80% DBC and yield, HCP <1000 ppm and leached rProtein A <25 ppm | Supports inclusion in a Chinese Protein A lifecycle screen and shows a service pathway for lifetime validation | Independent peer-reviewed head-to-head data, exact feed and assay comparability, commercial-lot consistency and scale confirmation |
Bio-Link AEX portfolio | Bio-Link reports unchanged viral-clearance capability through 150 reuse cycles in a supplier case study | Supports late-life viral-clearance testing as a differentiator | Virus panel, loading/conductivity conditions, statistical design and independent confirmation |
NanoMicro rigid polymer Protein A / IEX portfolios | Rigid polymer architecture is relevant where high flow and pressure stability are important | Supports screening for hydraulic and rapid-cycle applications | Public feed-cycle lifetime, cleaning, ligand leakage, impurity clearance and lot-to-lot data under the target process |
Bestchrom Protein A / IEX portfolios | Broad local portfolio and process support can simplify matched mode screening | Supports inclusion where supply, scale-up and service are procurement priorities | Product-specific cycled-feed data and multi-lot comparison against the chosen reference |
Bio-Link’s published webpage is a supplier source, not a peer-reviewed independent study. It reports that MaXtar ARPA retained more than 90% of initial DBC after 200 cycles of 0.5 M NaOH for 15 minutes, and another case study reports 200 actual purification cycles with stepped sanitization from 0.1 M to 0.5 M NaOH after cycle 140 (Bio-Link cleaning and lifespan study; Bio-Link lifetime validation case studies). The second dataset is more decision-relevant because feed was used, but the evidence still needs independent confirmation and full method comparability.
A domestic candidate should advance only after three gates:
Same-feed lifecycle: identical load, residence time, elution and CIP; early, middle and late cycle quality panels.
Scale and lot bridge: at least multiple resin lots and a scale-down model shown to represent production hydraulics and separation.
Supply and change control: manufacturing site, critical raw materials, release tests, change notification, technical support and contingency supply.
Use the iRight Resin Selector to narrow candidates by mode and matrix, then request a lifecycle-screen quotation. The RFQ should specify pack size, feed type, planned cycles, CIP recipe and required assays so quotations are technically comparable.
A useful protocol links a representative small-scale model to continued commercial verification.
State resin role, feed, load, residence time, wash, elution, regeneration, CIP, sanitization, storage and maximum holds. Rank risks to capacity, recovery, impurity clearance, pressure, carryover and microbial control.
Match bed height, linear velocity, load density, gradient or step volumes, column compression and relevant system dispersion. Demonstrate comparable chromatograms, yield, quality, pressure and efficiency against pilot or production data.
Run a chemical-exposure control and a complete feed-cycle arm. Use high-throughput cleaning screens only to select recipes; confirm the final recipe in a packed column.
Measure DBC, recovery, purity, HCP, DNA, aggregate, ligand leakage, HETP, asymmetry, pressure, blank-run carryover, TOC, bioburden and endotoxin as relevant. Include viral-clearance comparability at late life when the step contributes to viral safety.
Set alert, action and retirement criteria. Specify how a failed point, pressure excursion, wrong CIP or microbial event changes disposition. Use statistical trend rules where data density supports them.
Calculate cost per accepted batch and per gram for observed—not promised—cycles. Include buffer, labor, analytics, waste and expected failure loss. Stress-test clinical and commercial campaign lengths.
Trend every production cycle and reconcile the small-scale prediction with actual column history. Retire or investigate before the next batch if the forecasted margin is insufficient. For help sourcing enough material from matched lots and setting up comparison quantities, start a pre-filled resin-lifetime RFQ.
Select the resin that minimizes cost per cumulative accepted product mass inside a validated lifecycle—not the resin with the lowest price per liter or the largest isolated cycle count. A chemical-aging study defines compatibility. A cycled-feed study defines process performance. Commercial trending confirms that the prediction remains true.
Peer-reviewed experimental and modeling studies are used for mechanisms, lifecycle methods and multiproduct feasibility. Author affiliations are stated so readers can judge evidence provenance. FDA documents define inspection and cleaning expectations but do not test, rank or endorse commercial resins. Supplier application notes and webpages are used only to define candidate specifications and reported studies; their results are explicitly labeled supplier-generated. Product links identify current iRight catalog records and are not claims of technical superiority.
ResinFrontiers · iRight Bioprocess Chromatography Intelligence Series
Artificial intelligence can accelerate chromatography resin selection, but it cannot infer a universally “best resin” from catalog specifications. The practical route is a closed evidence loop: gener…